Production statistics and key performance indicators (KPIs) play an important role in modern production management and are the perfect combination for successful monitoring. They provide important operations data, give deeper insights into the performance of production processes, support strategic evaluation and continuous optimization, and promote communication within teams. In this blog article about using KPIs as tools for digitalization you will find out how to take advantage of this perfect duo in the digital transformation of your production landscape.
What Distinguishes KPIs from Production Statistics?
Key performance indicators are values calculated from production factors, which are presented as percentage ratios. They are an indicator of how well one aspect of production is developing over time. When assessing KPIs, the focus is on achieving strategic target values and monitoring changes.
Production statistics, on the other hand, focus on looking at specific frequencies and the duration of events or conditions at specific production machines. In contrast to KPIs, this usually includes operational values such as quantities, cycle time and the duration of events.
The Advantages of KPI Evaluation and Visualization
There are various aspects that benefit from the transparency that KPIs generate. These include communication among employees, proactive measures as well as reactive measures and learning effects. In order to take full advantage of these aspects, in addition to KPIs, various visualization media are needed that prepare the KPIs and make them available to the various user groups in the company. The topic of visualization is discussed in more detail in the section on KPI calculation tools.
Communication tool
KPIs provide pragmatic assessments of production status and help to objectify discussions about perceived performance or the causes of problems in teams and departments. Since KPIs provide a factual picture of current performance, you no longer need to rely on the gut feeling of individual employees. At the same time, KPIs can also represent a goal that needs to be achieved or a value that provides a basis for comparison. In the right environment, shared goals can be motivating and promote interdisciplinary and cross-divisional cooperation. This applies not only to colleagues within teams, but also to reporting to management.
Proactive measures
Taking action before a problem occurs is the ultimate display of agility in production management and monitoring. Expectations concerning topics such as predictive maintenance are therefore very high. Starting at KPI level makes it easy to get going. Changes in KPIs such as process performance, for example, can already indicate problems that can be resolved following more detailed analysis. Although KPIs cannot replace predictive maintenance, they are a first step in preparing new processes in order to alert experts to potential problems at an early stage.
Reactive measures
Before you can learn from mistakes, they need to be detected first. It is a challenge to detect particularly subtle and gradual deteriorations in a process. KPIs are ideally suited for these scenarios because they are analyzed and compared over a longer period of time. Changes in KPIs refer to specific periods of time, which can then be used to search for causes in technical process values.
Learning effects
As their name suggests, KPIs are primarily indicators that show changes in performance. At the same time, they can also help colleagues understand correlations and independently identify potential for improvement as a result. The prerequisite for the learning effect is that colleagues identify and communicate the connection between the KPI decline and the cause.
The Top 3 KPIs for Efficient Production
The opportunities for improvement in production are as wide ranging as the KPIs that can be measured and analyzed for this purpose. Here we present three KPIs that can significantly influence the route to successful production.
1. OEE: Overall equipment effectiveness
Overall equipment effectiveness (OEE) is indicated as a percentage calculated from three factors: availability, performance, and quality. Taking these three very different factors into account makes OEE a very comprehensive indicator. The focus is on the effective use of machines in production. A good level of OEE should always be above 80%. In addition to OEE, TEEP (Total Effective Equipment Performance) can be calculated, which also takes into account utilization over a calendar year.
OEE (%) = availability factor × performance factor × quality factor
- Availability factor (%) = uptime / available time
- Performance factor (%) = total production / (target production rate × operating time)
- Quality factor (%) = good parts production / total production
2. Cycle time: time taken to produce one product
The cycle time applying to the whole production line indicates the time required to produce a product. However, there are also cycle times for individual machines, which indicate the time for the process cycle of the machine. The cycle time of individual machines is often specified in the machine manufacturer's specifications.
Cycle Time = Production End Time - Production Start Time
3. Yield: output
The yield is an adjusted output figure that only counts products that have been manufactured without defects. In addition to yield, the First Pass Yield (FPY) only includes products that leave production as good parts without rework.
Yield = (Finished Products - Defect Products) / Time
The 3 Most Important Production Statistics for Successful Manufacturing
In production manufacturing, statistical insights are an indispensable tool for ensuring high product quality and minimizing downtime. Below, we present the top 3 production statistics to help you identify trends and patterns in order to take proactive measures to increase efficiency.
1. Alarm statistics
The alarm statistics document machine alarms, their duration and frequency. The duration and frequency of alarms can be used to derive their impact on productivity and availability. These production statistics are usually presented in various bar charts, which show the alarm frequency, the mean value of the alarm duration and the total duration of the alarms.
2. Machine status according to SEMI E10
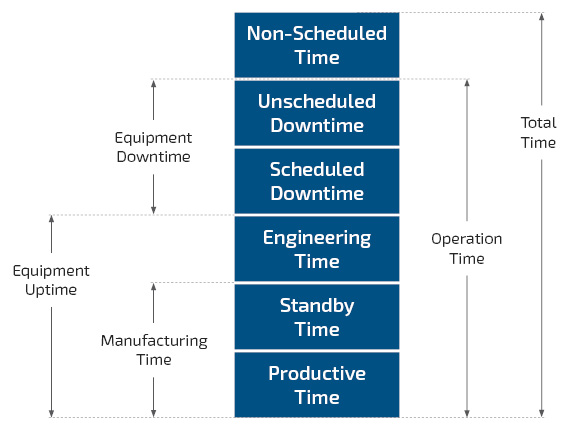
To minimize downtimes, it is necessary to subdivide the times and operating states according to their cause. SEMI E10 provides a model in which times are divided into sub-categories, such as scheduled downtime and un-scheduled downtime. These production statistics allow an evaluation of the various downtimes during the operation time of the machine and make improvements measurable in specific units.
3. Product defect statistics
Researching the occurrence of product defects provides clear pointers towards where a manufacturing process can be improved. These production statistics are also about identifying occurrence clusters and analyzing their location and time in order to determine the cause in the process values or machine parameters.
The Best Tools for Automatic KPI Calculation
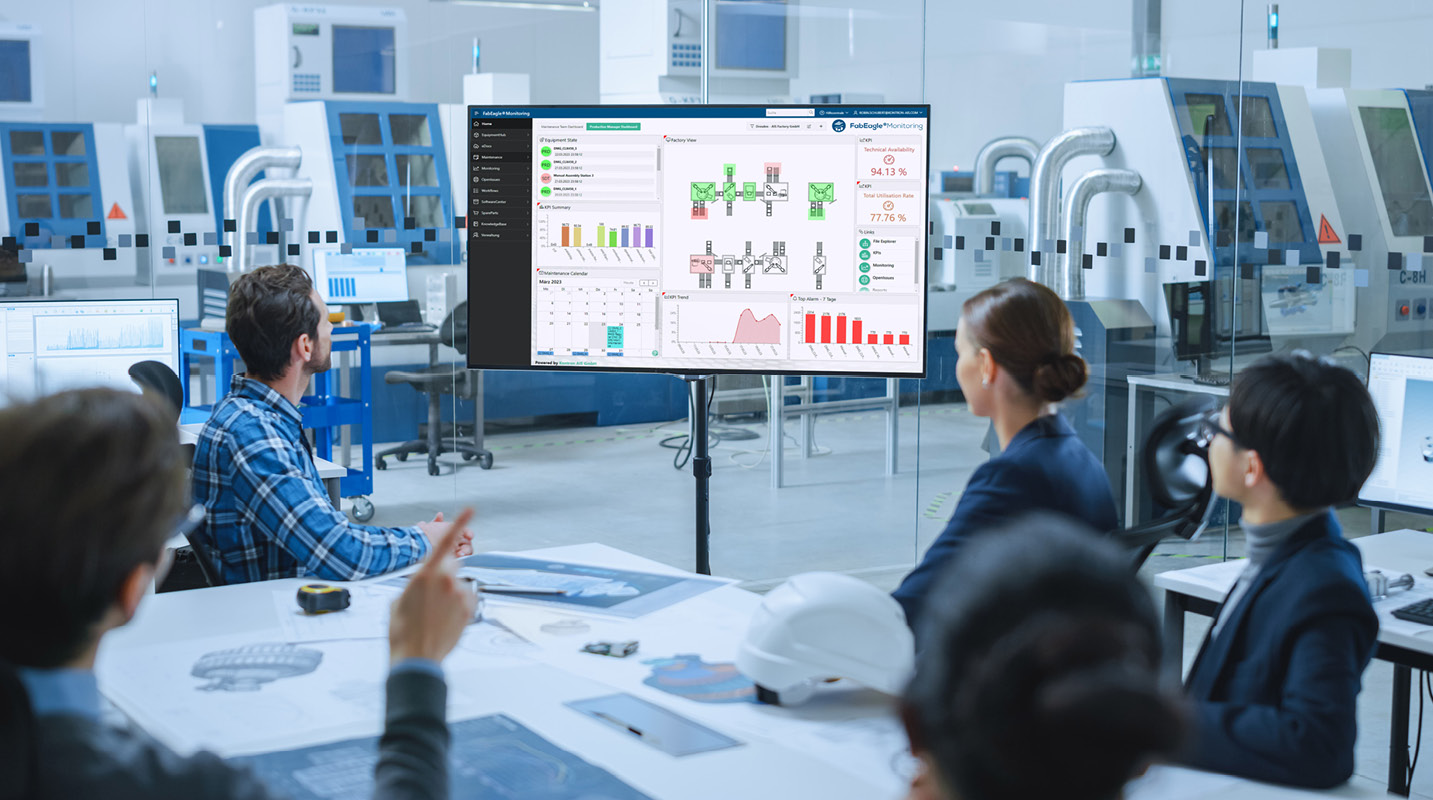
KPIs and production statistics are tools that should be easily accessible to provide a reliable comparison over many years. While tools such as Excel offer basic calculation functions, they are neither practicable on a fully automated system nor reliable in providing comparisons over the long term. For this purpose, production control systems such as FabEagle®LC are the most suitable, especially when statistics from multiple production lines need to be considered. If the process control functions are not required, a monitoring system such as FabEagle®Monitoring can also be used to acquire machine and production data (MDA/PDA).
Both software solutions offer factory operators the following advantages:
- Central data collection and data storage
- Automatic calculation and visualization of indicators
- KPI reporting including an overview of all process and product data
- Diverse applications beyond visualization, e.g. planning, management and control
- Availability of data across departments and locations, e.g. office management, team management or directly on the production line
Your Route to Optimized and Digitalized Production
Using key performance indicators offers numerous advantages for optimizing production. In contrast to pure production statistics, which focus on operational values such as production volumes and cycle rates, KPIs enable a strategic evaluation of production performance over longer periods of time. By visualizing and evaluating KPIs, companies can improve communication between employees, implement proactive and reactive measures, and achieve a lasting learning effect.
KPIs such as OEE, cycle time and yield are valuable tools for identifying potential for improvement and increasing efficiency. Overall equipment effectiveness provides a comprehensive overview of productivity, while cycle time and yield provide insights into specific production processes. By comparison, production statistics such as alarm statistics, machine states in accordance with SEMI E10 and product failure statistics provide detailed operational data that is essential for fine-tuning machines and processes.
You can start out at any time on the route to optimized and digitalized production based on continuous monitoring with KPIs and production statistics. It is best to start with a pilot phase for applying KPIs to your production scenario. This makes it easy to test the integration of these indispensable tools and get real-time insights into the advantages they offer. Start now and take the first step towards digitalized and optimized production!
Would You like to Find out More about KPIs and Production Statistics as a Tool for Digitalizing Your Production? I Would Be Happy to Help You!


