How Data Analysis at Process Level Boosts Service Success in Equipment Manufacturing
Performance data is invaluable in mechanical engineering. It provides valuable insights into the process efficiency and functionality of machines and systems. While alarms and error messages provide initial information about the machine condition and give important clues for troubleshooting by severity and type, the data analysis of process values goes one step further. It offers an in-depth data analysis of causes and cross-module relationships that affect the shop floor and all the machines and systems as a whole.
A distinction is made between different types of process value:
- Numerical process values: These are integers or floating-point numbers. The notation as well as the limits can be configured. This type of process value is a typical control variable.
- Textual process values: This type of process value can contain all alphanumeric characters.
- Boolean process values: This data is binary and shows, for example, whether a switch is on or off.
This is how process values are recorded and configured
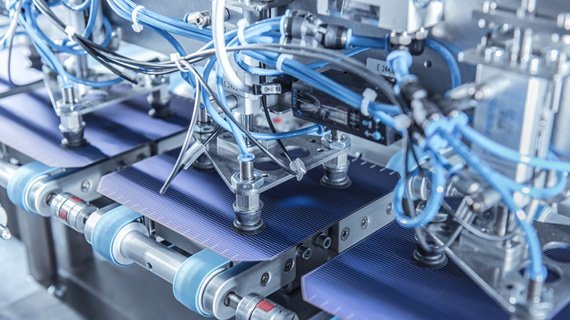
In mechanical engineering, process values are recorded close to production using sensors and actuators and, in automated systems, are usually bundled by a control system or in a database. Before the process data is visualized, the resulting data is usually preprocessed by a local edge device, which serves as a buffer and pre-filters data for transfer to on-prem or cloud solutions. At this point, data processing is programmed or simply configured, depending on the programming interface. This means that the process values are simply translated from an industrial interface of the system (e.g. MQTT, S7, HTML databases) into the target interface, such as the REST web standard. In addition to configuration using the REST standard, the process values can also be configured manually or by importing a CSV file into the target solution.
Side note: Transparent handling of sensitive machine data
Data-driven, digital shop floor management is becoming increasingly important for machine operators — even in medium-sized companies, the specifications for the degree of automation and digitalization are becoming ever higher. However, investments in comprehensive IT solutions for real-time evaluation of the usually very heterogeneous machinery are extremely costly. Machine manufacturers are familiar with the challenges faced by operator sand are also very keen to improve overall equipment effectiveness and understand their own machines better under load, even after commissioning, in order to make service and support more proactive and predictive. That is why more and more machine manufacturers are taking the initiative themselves and offering operators real-time evaluations as a digital service as part of a maintenance or service contract with access to a customer portal.
Sharing the performance data of individual or multiple machines at process level with the machine manufacturer is not easy for all operators. Although they are aware of the benefits, they treat the process values as intellectual property, the disclosure of which allows conclusions to be drawn about their own production process, with the risk that this could lead to competitive disadvantages.
Transparent handling of machine owners’ sensitive machine data can make a real difference. This starts with the communication of the service package and the terms of use, in order to clearly lay down for both parties why the individual machine data is being collected and what added value this results in for the production process. The next step is for both parties to choose the required volume of data as part of the machine connection and agree on an option of future expansions following appropriate configuration. The result is the transparent visualization of machine data for manufacturers and owners on a central platform — on-prem or in the cloud.
Visualize and evaluate process values
The benefits of in-depth evaluation of process values are clear to machine manufacturers:
- Comparability across regions and machine types
- Proactive service due to early notification if values exceed or fall below specified limits
- Important conclusions about function, operation and maintenance frequency for product development
With the benefits mentioned above, it is obvious that machine manufacturers benefit when they use a data-driven strategy. The question is, however: How can this data be used effectively to increase efficiency? That is where the EquipmentCloud® digital transformation solution comes into play. Kontron AIS has created purpose-specific evaluation tools for service and after sales in mechanical engineering to make them available to operators as well in a customer portal.
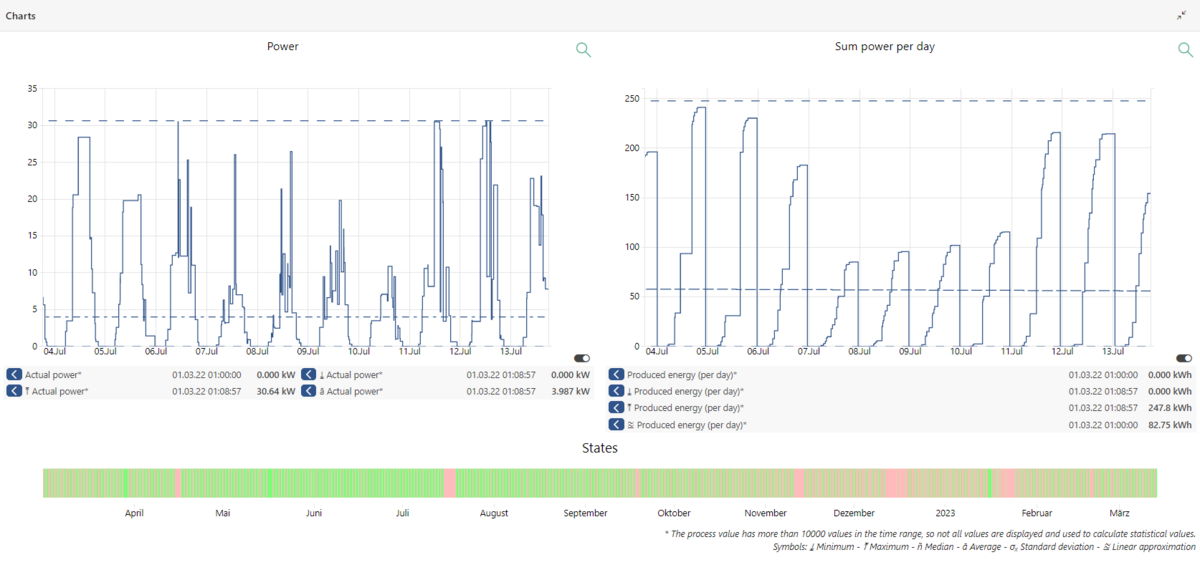
In the EquipmentCloud® monitoring module, simple ad-hoc evaluations can be carried out for individual machines or specific machine types by correlating various process values in individual diagrams and implicitly saving them. This means that short-notice and urgent analyses can be carried out quickly and easily.
However, if more complex and regular evaluations of process values are planned over a longer period of time, profiles can be used instead. In contrast to ad-hoc evaluation, each profile can contain several diagrams and the diagrams are synchronized with each other using dynamic time filters (zoom in and out).
In addition, each chart can be opened in its own browser tab or in full screen mode. The big advantage of profiles is that if they are created privately, they can also be released later to colleagues, customers or partner companies and visibility levels can also be defined. The prerequisite is that users have access to the equipment hierarchy. The profiles also serve as a navigation menu, i.e. each hierarchy can have several profiles grouped according to subject.
This offers the machine manufacturer the advantage that, after connecting the customer system, depending on the chosen service package, they can provide a selection of standard profiles using a practical copy function in just a few clicks. Alternatively, the manufacturer discusses in detail with the operator which process values are relevant and compiles them in individual profiles.
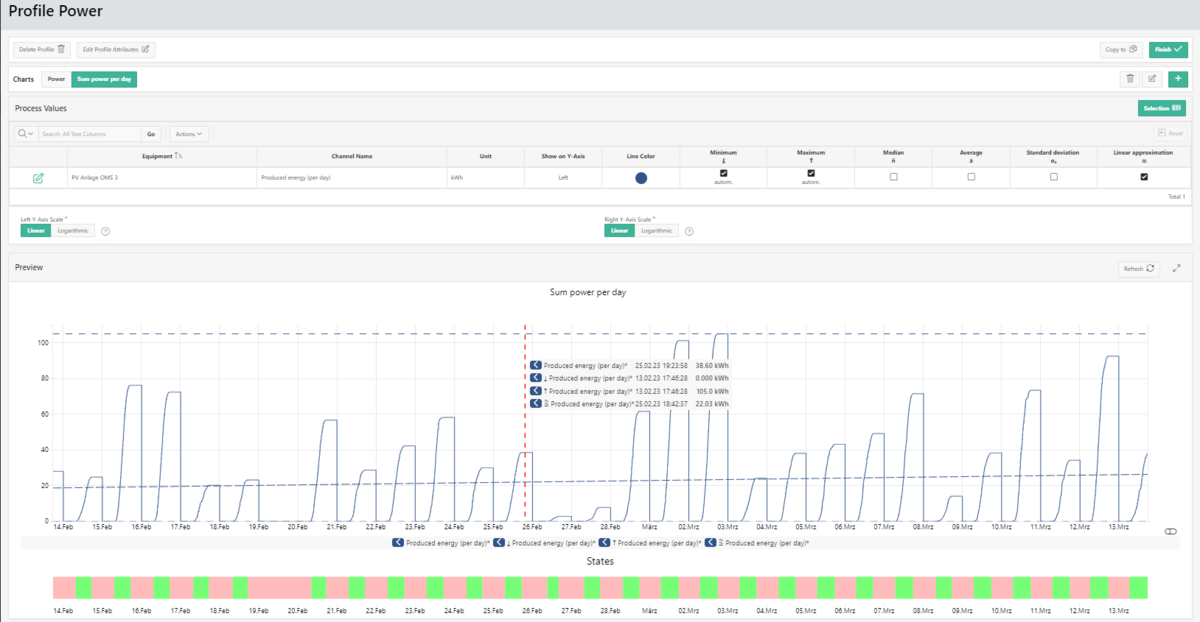
Numerous attributes are available for the evaluation, which can be defined for each diagram within a profile, such as:
- Individual color selection of channels,
- Toggle Y-axes and legends,
- Definable measurement units and tooltips for diagrams
- Statistical features such as maximum and minimum, median, average, standard deviation, and linear approximation.
This provides process engineers and service-oriented application engineers with a comprehensive set of tools to:
- Analyze the performance data of individual machines
- Quantify energy and resource consumption, and
- Carry out process-related service and quality analyses across machines regardless of location.
Further processing of process values
In addition to in-depth data analysis, process values also play an important role in maintenance and servicing. They can be used as triggers in the form of changing switching states, incremental counters or limit values for urgent repairs, planned maintenance and servicing. For this reason, the interplay of continuous data analysis at process level and the history of actual maintenance carried out in the EquipmentCloud® is an integral part of the digital transformation solution. The integration of the monitoring and maintenance module allows important conclusions to be drawn about causes and at the same time helps to forecast maintenance cycles more reliably.
But that's not all: Bundling machine data in one place such as EquipmentCloud® provides a good basis for further processing of the data in third-party systems, enriching it with further information and consolidating it. A comprehensive Monitoring REST API is available to the machine manufacturer as well as the operator for this purpose. This makes it possible to query the consolidated data (process data in particular quickly generates a high volume of data depending on the data frequency and number of values) using multi-level authentication via GET requests. A REST API wrapper was created as a Python module for further processing using standard AI tools with Python as the programming language. This has been published as a project in the Python Package Index and can be installed and used as open source in Python environments using an MIT license. The Monitoring REST API and the matching Python module are designed to offer data scientists in particular easy data streaming over a period of several months, making it easier to carry out statistical and correlation analyses based on real-time data. As a result, AI learning models can be developed that in future can be used as triggers for maintenance and repair work on the live system.
Book a live demo now and discover the range of functions of process-level data analysis in EquipmentCloud® for your machines and systems.